Hazards refer to physical factors, such as rainfall or temperature, that have the potential to cause damage to property, disrupt livelihoods and services, lead to economic losses, or harm the environment. These can be gradual changes, like a slow increase in temperature or precipitation over time, or sudden weather-related events such as droughts, floods, and heatwaves (Source: UNDRR). Climate hazards, specifically, are extreme weather events and environmental changes driven by climate change, which have significant impacts on communities and ecosystems. These include rising temperatures, prolonged droughts, intense rainfall, flooding, and shifts in seasonal weather patterns.
Understanding climate hazards is crucial for South Africa as it seeks to develop effective adaptation and mitigation strategies to safeguard communities, protect natural resources, and promote resilience in the face of a changing climate.
Climate change is driven by changes in the Earth’s atmosphere, oceans, land, and ecosystems. Climate models predict how factors like temperature and rainfall might change in the future, showing how different forces work together to impact the planet. Climate change is seen in long-term shifts in average conditions, such as rising temperatures or changing rainfall patterns, often compared to past periods (e.g., 1961-1990 vs. 2070-2100). It is also measured against global temperature goals, like those in the Paris Agreement, which aims to limit warming to well below 2°C above pre-industrial levels (Source: CSIR).
Toggle down each climate hazard below for more information.
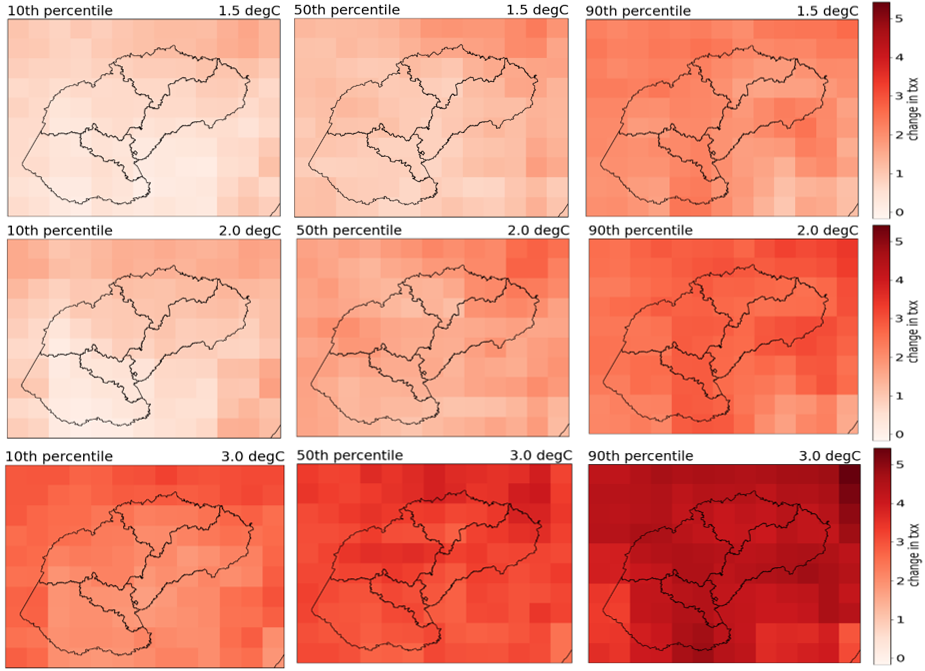
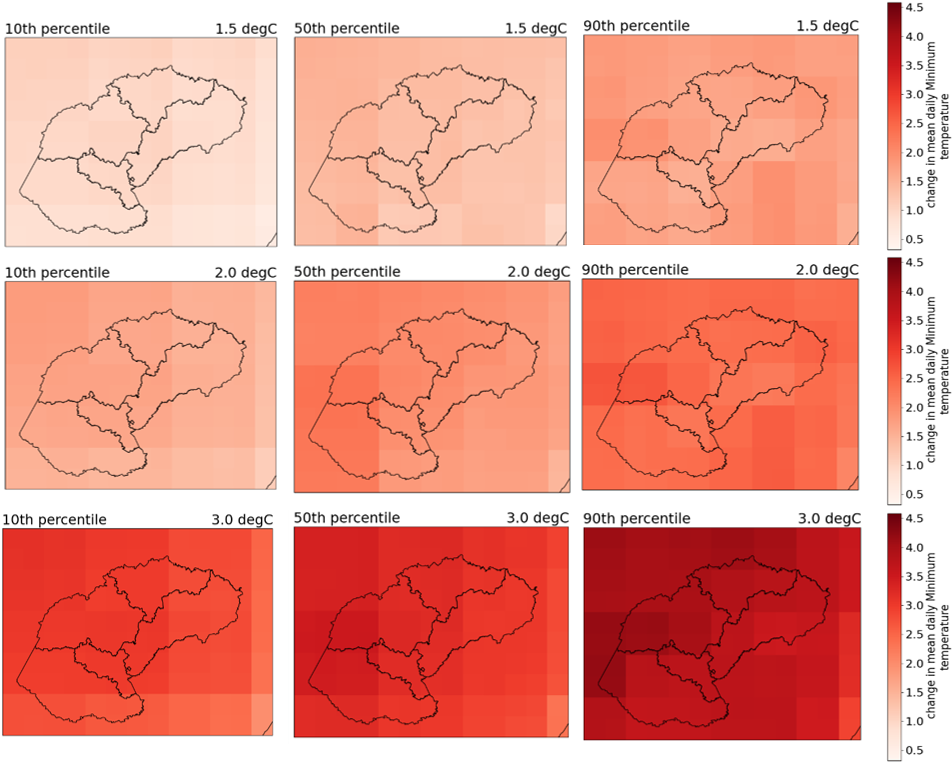
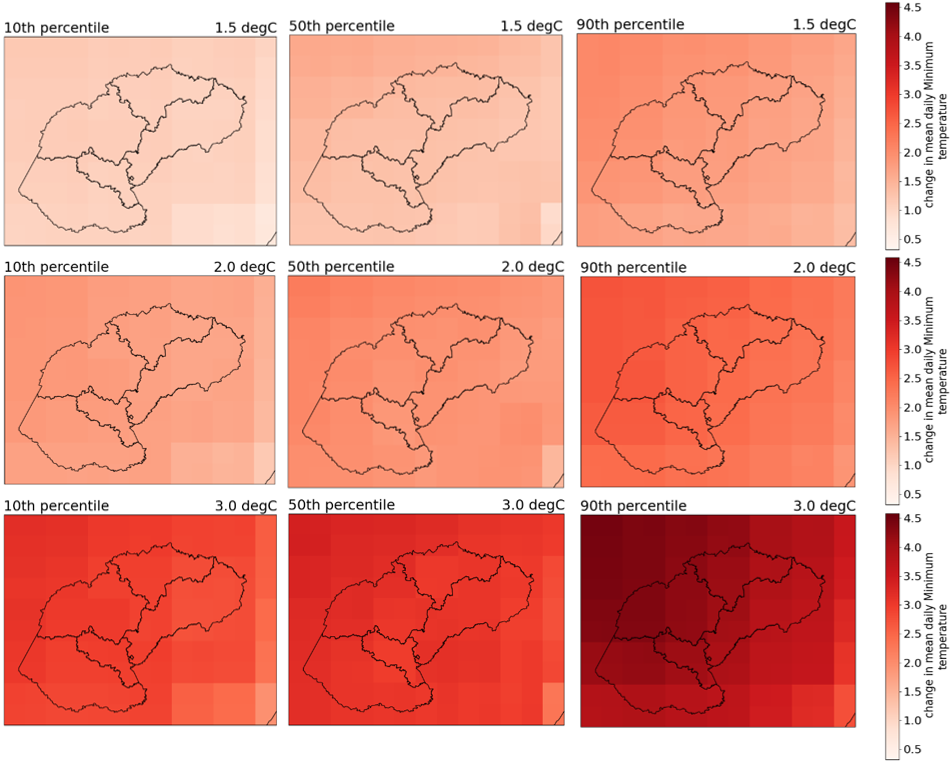
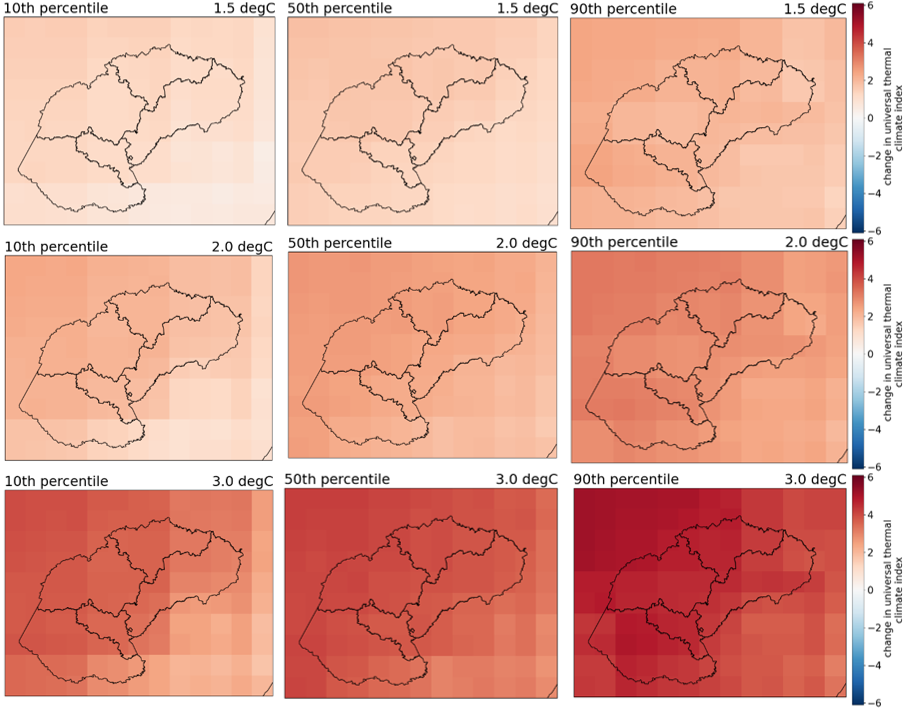
This series of maps illustrate four climate extreme indices, depicting projected changes in 1) annual maximum temperature; 2) annual minimum temperature; 3) annual mean temperature; and 4) the universal thermal climate index. For each metric, the projected changes in average global temperatures are shown for warming levels of 1.5°C, 2.0°C, and 3.0°C, relative to the baseline period of 1961–1990. The above climate extreme indices indicate that severe and extreme temperatures may be present over large parts of Free State districts. This will have implications for Health, Agriculture, Water Resources, and Food Security, Forestry/GHGs, and Energy due to heat stress. The heat stress resulting from these temperature extremes can impact various sectors in different ways.
Reference period (1961-1990) average annual maximum temperatures:

Projected average annual maximum temperature relative to the 1961-1990:
Reference period (1961-1990) average annual minimum temperatures:

Projected average annual minimum temperature relative to the 1961-1990:
Reference period (1961-1990) average annual mean temperatures:

Projected average annual mean temperature relative to the 1961-1990:
Reference period (1961-1990) average annual universal thermal climate index:

Projected average annual universal thermal climate index relative to the 1961-1990:
Source: CSIR
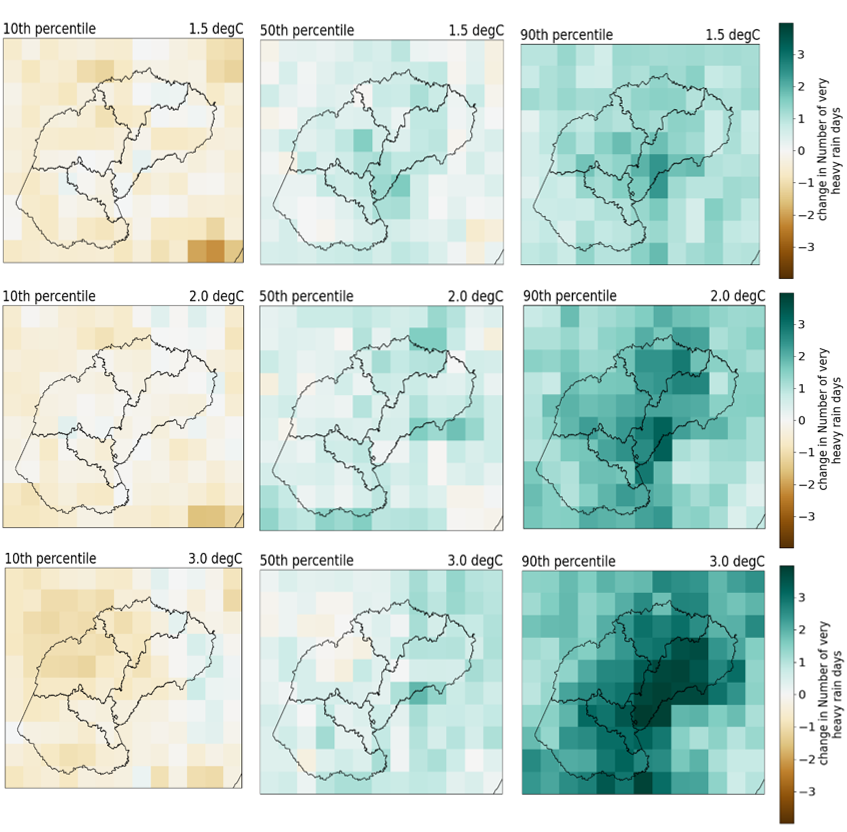
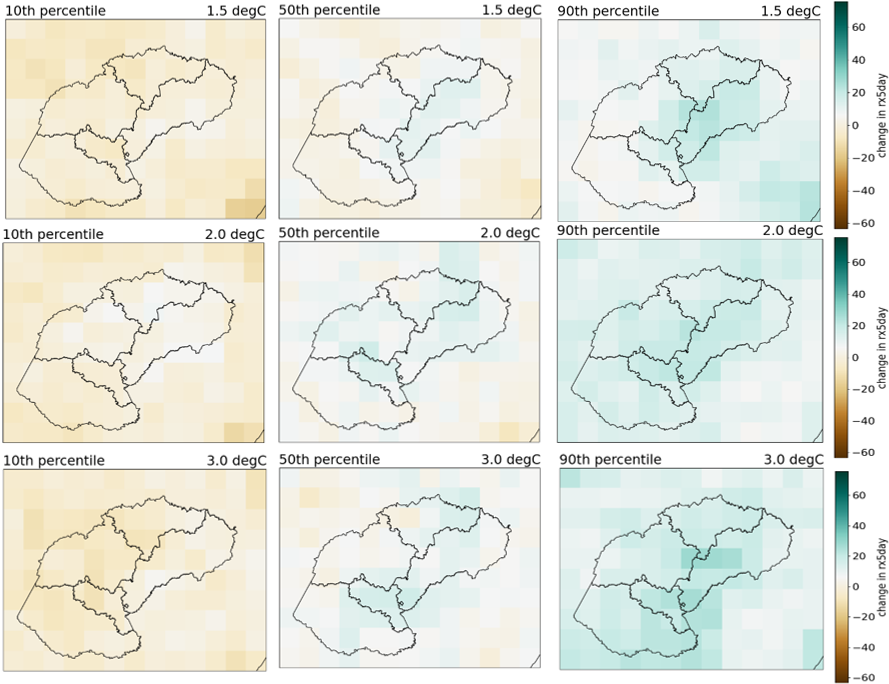
This series of maps illustrate two climate extreme indices, depicting projected changes in 1) annual total number of very heavy rainy days ≥ 20mm and 2) annual maximum 5-day rainfall days. For each metric, the projected changes in average global temperatures are shown for warming levels of 1.5°C, 2.0°C, and 3.0°C, relative to the baseline period of 1961–1990. The above climate extreme indices indicate that a large part of the Free State may experience an increased number of days of rainy days while some parts will experience no change or decreased number of days of rainy days.
This will have implications for Agriculture, Water Resources, and Food Security, Disaster Risk Reduction, and Forestry/GHGs due to heavy rainfall events. The heavy rainfall events resulting from these number of extreme rainy days can impact various sectors in different ways.
Reference period (1961-1990) average annual total number of very heavy rainy days ≥ 20mm:
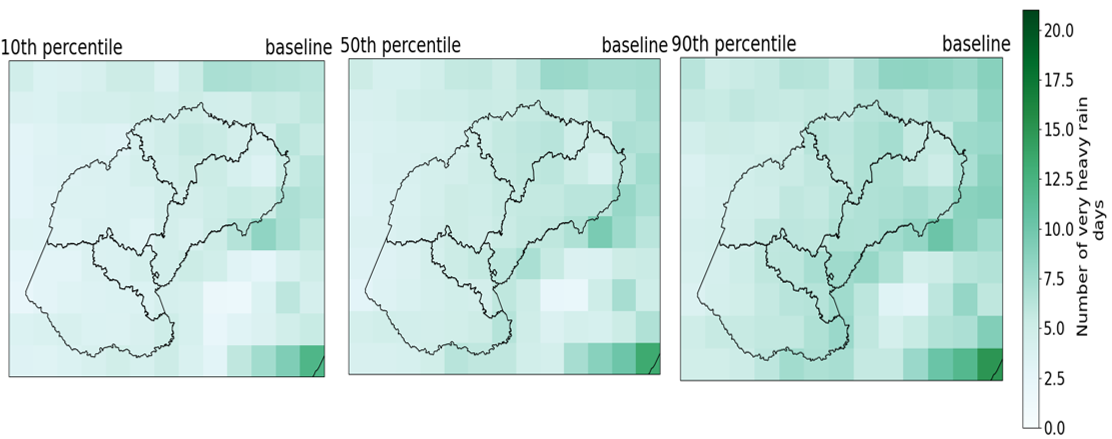
Projected annual total number of very heavy rainy days
relative to the 1961-1990:
Reference period (1961-1990) average annual maximum 5-day rainfall total:

Projected annual maximum 5-day rainfall total relative to the 1961-1990:
Source: CSIR
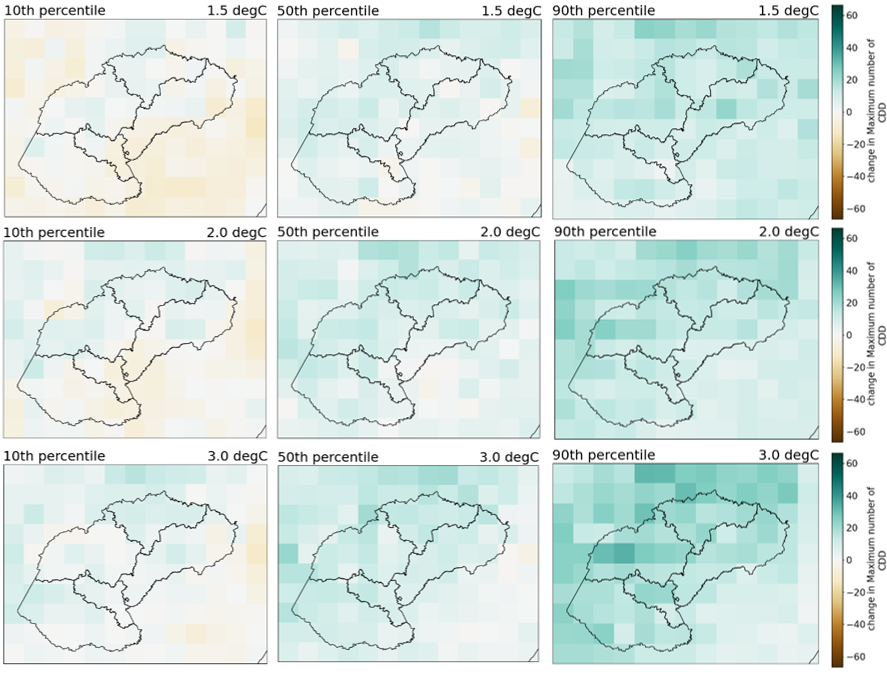
This series of maps illustrate two climate extreme indices, depicting projected changes in 1) annual maximum number of consecutive dry days and 2) annual standardized precipitation index (SPI). For each metric, the projected changes in average global temperatures are shown for warming levels of 1.5°C, 2.0°C, and 3.0°C, relative to the baseline period of 1961–1990. The above climate extreme indices indicate that a large part of the Free State may experience a drier future like much of the Southern Hemisphere is expected to experience an increased likelihood of drought, as well as a higher chance of low-frequency, high-impact rainfall extremes.
This will have implications for Health, Agriculture, Water Resources, and Food Security, Disaster Risk Reduction, and Forestry/GHGs due to dry conditions for longer periods. The dry conditions resulting from these number of consecutive dry days and SPI can impact various sectors in different ways.
Reference period (1961-1990) average annual maximum number of consecutive dry days:

Projected annual maximum number of consecutive dry days relative to the 1961-1990:
Reference period (1961-1990) standardized precipitation index (SPI) trends:

Projected standardized precipitation index (SPI) trends:
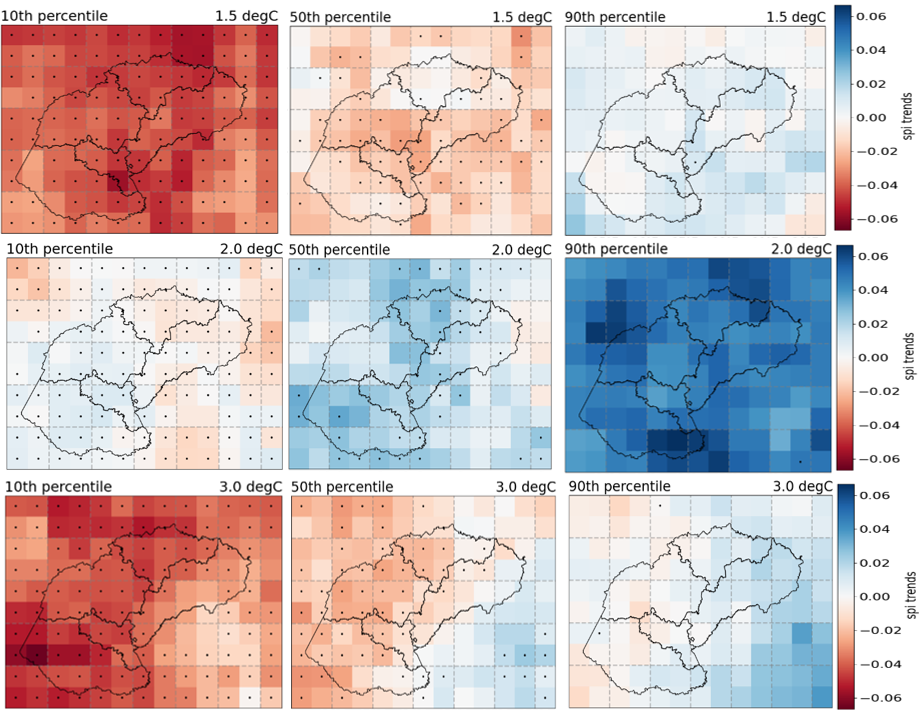
Source: CSIR
This series of maps illustrate two climate extreme indices, depicting projected changes in 1) annual heatwave duration and 2) annual heatwave magnitude. For each metric, the projected changes in average global temperatures are shown for warming levels of 1.5°C, 2.0°C, and 3.0°C, relative to the baseline period of 1961–1990. The above climate extreme indices indicate that a large part of the Free State may experience an increased length of the longest heatwaves, however, the magnitude of the heatwaves might not intensify/experience no change in the near future but increase in the far future.
This will have implications for Health, Agriculture, Water Resources, and Food Security, Forestry/GHGs, and Energy due to heat stress. The heat stress resulting from the length of the longest heatwave and its magnitude can impact various sectors in different ways.
Reference period (1961-1990) average annual heatwave duration:

Projected average annual heatwave duration relative to the 1961-1990:
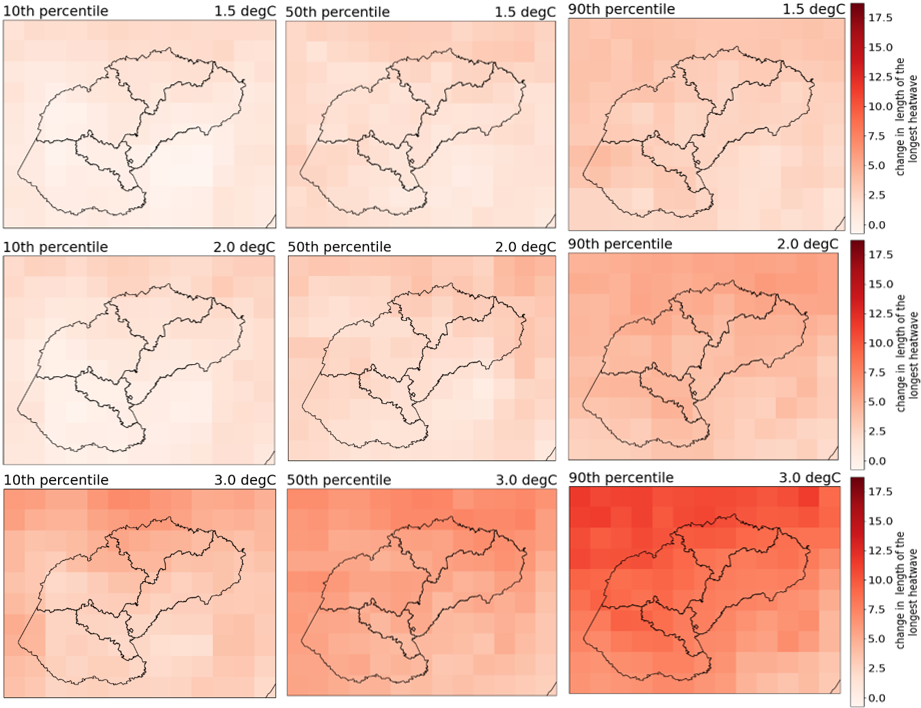
Reference period (1961-1990) average annual heatwave magnitude:

Projected average annual heatwave magnitude relative to the 1961-1990:
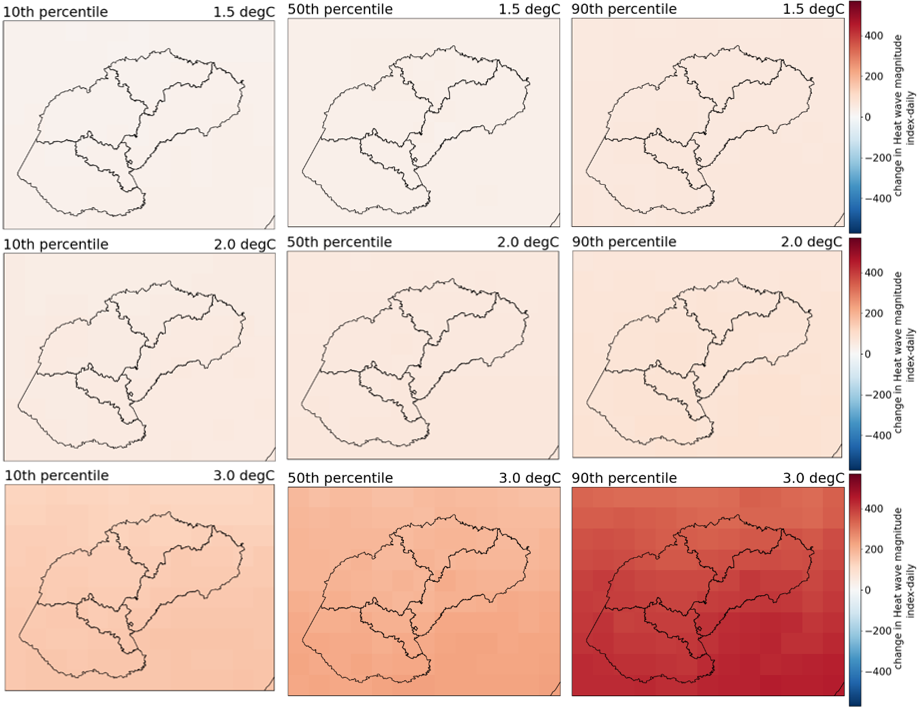
Source: CSIR
This series of maps illustrate one climate extreme index, depicting projected changes in 1) Fire weather index ≥ 24. For this metric, the projected changes in average global temperatures are shown for warming levels of 1.5°C, 2.0°C, and 3.0°C, relative to the baseline period of 1961–1990. The above climate extreme index indicates that a large part of the Free State may experience an increased number of days with a fire weather index ≥ 24 indicating the likelihood of change of wildfire.
This will have implications for Health, Agriculture, Water Resources, and Food Security, Disaster Risk Reduction, Energy, and Forestry/GHGs due to the number of days with a fire weather index ≥ 24. The fire weather index resulting from the number of days with a fire weather index ≥ 24 can impact various sectors in different ways.
Reference period (1961-1990) average annual fire weather index ≥ 24:

Projected average annual fire weather index ≥ 24 relative to the 1961-1990:
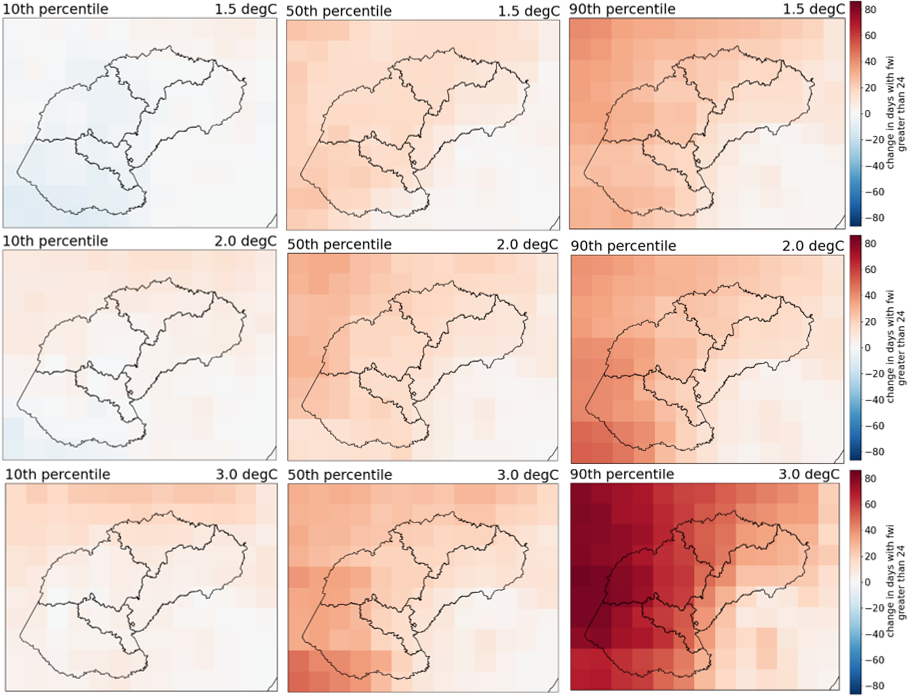
Source: CSIR
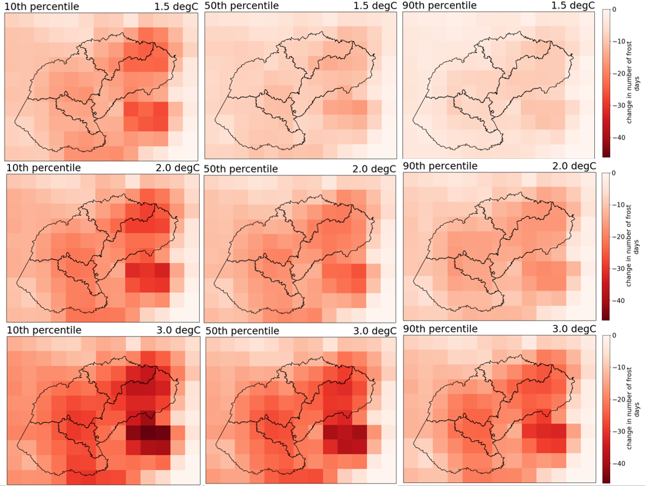
This series of maps illustrates one climate extreme index, depicting projected changes in Frost Days. Frost Days (FD) is defined as the sum of the days where the minimum air temperature is equal to or below 0 °C during the period of interest (yearly and seasonally).
For this metric, the projected changes in the sum of days where the minimum air temperature is equal to or below 0 0C are calculated for global warming levels of 1.5°C, 2.0°C, and 3.0°C, relative to the baseline period of 1961–1990. The climate extreme index indicates that a large part of the Free State may experience a decline in the number of frost days. This will have positive and negative impacts mainly on the Agricultural Sector as frost-free days will allow for longer growing seasons, ultimately increasing crop production and outputs. On the other hand, longer growing seasons will require water for irrigation.
Reference period (1961-1990) Frost Days (FD):

Projected Frost Days (FD) relative to the 1961-1990:
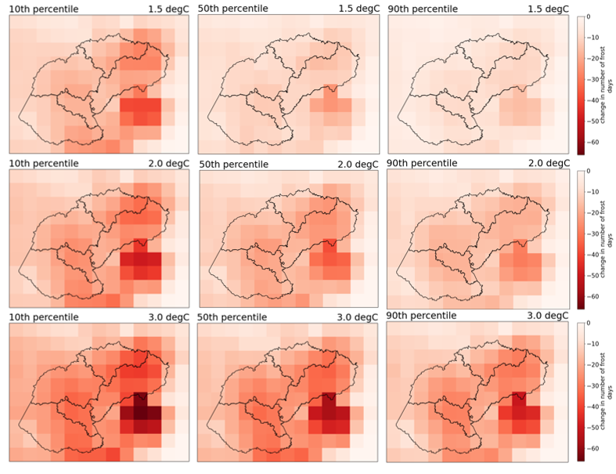
Frost Days (FD)- Sum of the days where the minimum air temperature is equal to or below 0 °C annually.
There is high confidence in the climate change signal looking at the frost days over the Free State region.
The Free State generally experiences frost days that endanger the agricultural sector the most.
The number of frost days over the Free State are projected to have a significant reduction. The reduced number of frost days are likely to increase with increasing GWLs.
The most changes will be experienced over the escarpment regions, especially along the eastern tip of the Thabo Mofutsanyana region.
Reference period (1961-1990) Frost Days (FD):
Projected Frost Days (FD) relative to the 1961-1990:
Discover climate risks and hazard data for the Free State

Copyright © 2024 Department of Forestry, Fisheries and the Environment.
